The demo developed by the consortium partners seele, Fraunhofer HHI and Carl Zeiss 3D Automation deals with the improvement of quality inspection processes on the construction site. By using a powerful, cloud-based network and computer infrastructure, 3D scans for quality and component inspection can be transferred and processed faster. In combination with modern mixed-reality technology, the inspection process can be simplified and made more convenient. Watch demo here
Using a a scalable infrastructure
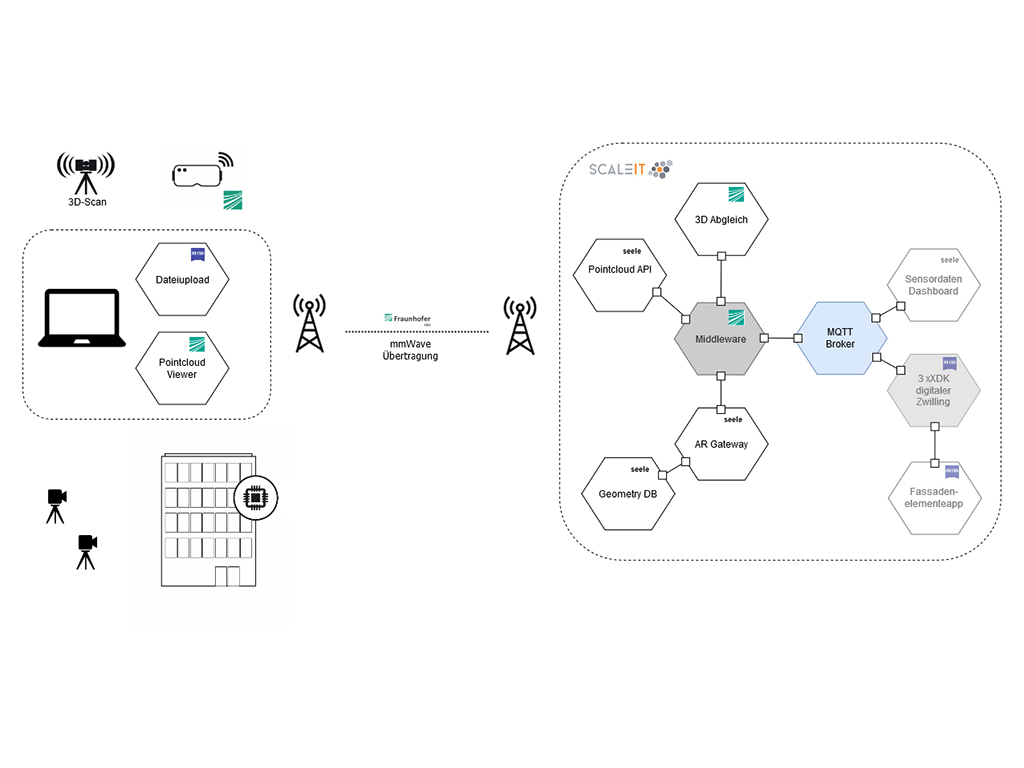
In the demo, high-performance, scalable technologies are used for the target/actual comparison. Common LAN cabling was replaced by fast 5G wireless technology. So-called mmWaves transmit the point clouds from the FARO scanner or other data at a speed of at least 2 Gigabit/s to the node end point to the connected, high-performance network and computer infrastructure. To process the data-intensive point cloud models, a locally hosted cloud environment with ScaleIT technologies is used. Integrated high-performance edge or enterprise servers prepare the 3D point clouds using an algorithm as a heat map for visual inspection. The retransmission of the comparison model is also done via mmWave. By exploiting the full potential of the virtual environment, the demo delivers not only a faster but also a more accurate result.
Using Mixed Reality technologies
As part of the demo, DigitalTWIN simultaneously tests the use of mixed reality technology: instead of being displayed on a screen, the comparison between the reference and target model is shown in AR glasses (HoloLens). The inspector is then presented with the 3D model projected into a virtual environment. The user can now control, zoom and rotate the model, allowing detailed inspection from different perspectives. Points with a high deviation from the tolerance range are visually highlighted in the HeatMap. At the same time, metadata and live values of the data throughput between the 5G nodes can be accessed via a 5G user interface. They are displayed to the user in the form of a speedometer and show deflections during data transmission.